Mode mixing in EMD
One of the problems researchers claim that empirical mode decomposition (EMD) has is the difficulty of unmixing mixed modes [1]. Usually it means that EMD cannot (always) untangle two or more sine mono frequency components $s(t) = \sum_{n=0}^{N} A_n\sin(\omega_n t)$. Some say that this is big issue and propose tweaks to EMD [2], additional methods [3] or provide restrictions on when it is possible to extract [4]. The most widely analysed case is for $N=2$, i.e. $s(t) = \sin(t) + b \sin(\omega t)$, where $b$ and $\omega$ are relative amplitude and frequency respectively. This has been studied thoroughly in [4].
Why is this not necessarily an issue? EMD is supposed to extract intrinsic mode functions (IMFs), i.e. functions with a single mode/frequency. Although, when hearing oscillations many probably think about sinusoid, but it actually can be in any form. Wavelets are an example of weirdly looking oscillations (small waves that have beginning and end). As for the definition of oscillatory behaviour there is not a single best one. Huang et al. [5] defined IMF as a function that:
- has number of local extrema and zero-crossings equal or different by 1,
- mean of its top and bottom envelopes is zero.
Authors were aiming to meta-define a function that is suitable for Hilbert transform, by which they have defined $\omega(t)$ instantaneous frequency. Components of decomposition, i.e. IMFs, are thus described in formula $c_j (t) = a(t) cos( \phi(t) )$, where $a(t)>0$ is an amplitude and $\phi(t) = \int \omega(t) dt$ is a phase. Representation of a function by multiplication of two other functions is ambiguous, same as number 5 can be presented as $5 = 2 \cdot 2.5$ or $5 = 0.2 \cdot 25$. Here is where the Hilbert transformation plays a role. It provide a recipe for representing signal in amplitude times phase functions, but it is still one of the methods. Nevertheless, once we are allowing signal to have modulation in amplitude mode mixing makes little sense. Taking two sinusoids as an example, they can be either in written in form of $s_{I} (t) = \sin( \omega_1 t) + \sin( \omega_2 t)$ or, using trigonometric properties, as $s_{II} (t) = 2 \cos(\frac{\omega_1 - \omega_2}{2} t ) \sin(\frac{\omega_1 + \omega_2}{2} t) $. In the first form we have two sines with constant amplitudes, whereas in the second one there is a single sine function, of frequency $0.5(\omega_1+\omega_2)$, which amplitude is modulated by $2\cos(\frac{\omega_1 - \omega_2}{2} t )$. Both forms give exactly the same result - the difference is in written representation. It is up to user to decide how he sees it.
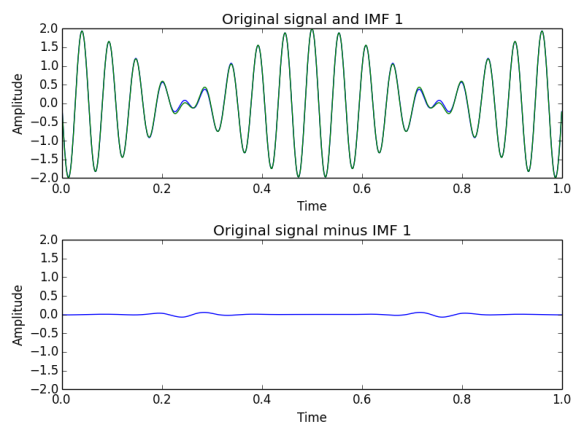
A numerical example. Given two sines EMD is behaving choosy on parameters such as a relative amplitude and a relative frequency. Figure 1 presents EMD decomposition on signal $S_1 = \cos(15\pi t ) + \cos(39\pi t)$. It can be seen that two extracted IMFs have exactly the frequencies (number of extrema divided by 2) of which the signal has been synthesised. This is due to the big difference between used frequencies. If one uses close values, i.e. allowing for beating, then the most information is contained in the first IMF (Figure 2). To produce this Figure sines with frequencies 17.5 Hz and 19.5 Hz ($S_2 = \cos(35\pi t) + \cos(39\pi t)$) were used. Second row of Figure 2 shows the difference between input signal and first IMF - barely visible on the same amplitude scale.


References:
[1] N. E. Huang and Z. Wu, “A review on Hilbert-Huang transform: Method and its applications to geophysical studies,” Rev. Geophys., vol. 46, no. 2, p. RG2006, Jun. 2008.
[2] Z. Wu and N. E. Huang, “Ensemble Empirical Mode Decomposition: A Noise-assisted Data Analysis Method',” Adv. Adapt. Data Anal., vol. 01, no. 01, pp. 1–41, Jan. 2009.
[3] R. Deering and J. J. F. Kaiser, “The Use of a Masking Signal to Improve Empirical Mode Decomposition,” in Proceedings. (ICASSP ’05). IEEE International Conference on Acoustics, Speech, and Signal Processing, 2005., 2005, vol. 4, pp. 485–488.
[4] G. Rilling and P. Flandrin, “One or Two Frequencies? The Empirical Mode Decomposition Answers,” IEEE Trans. Signal Process., vol. 56, no. 1, pp. 85–95, Jan. 2008.
[5] N. E. Huang, Z. Shen, S. R. Long, M. C. Wu, H. H. Shih, Q. Zheng, C. C. Tung, H. H. Liu, and N.-C. Yen, “The Empirical Mode Decomposition and the Hilbert Spectrum for Nonlinear and Non-stationary Time Series Analysis,” Proc. R. Soc. A Math. Phys. Eng. Sci., vol. 454, no. 1971, pp. 903–995, Mar. 1998.